

We measure what impacts your health on your day-to-day.
We look at the three most important areas of your health.
Energy
Your average blood sugar over the past three months. This number shows whether your body handles glucose well or if you're developing insulin resistance. High levels indicate diabetes risk. Unlike daily glucose tests, HbA1c reveals long-term control and is the key marker for diabetes diagnosis and management.
Measures how hard your body works to manage blood sugar. High insulin means your cells aren't responding properly anymore. This often rises before blood sugar becomes problematic, making it an early warning sign of metabolic trouble. Lifestyle changes can significantly improve this marker.
The 'sunshine' vitamin. Low levels often cause fatigue, poor immune function, and reduced bone density. It's one of the most common deficiencies and one of the simplest to correct. Most people feel the difference within weeks. Your body makes it from sunlight, but many people in the UK need supplementation, especially in winter.
Rises when liver is under strain. Your liver processes everything you consume, so this number reflects how well it's handling the load. Elevated levels are reversible if caught early through diet, exercise, weight loss and reducing alcohol. A key marker for non-alcoholic fatty liver disease.
Shows liver and muscle cell breakdown. Stays elevated when your body isn't recovering properly from alcohol, intense exercise, or metabolic stress. A clear signal to adjust before damage accumulates. Interpreted alongside ALT to understand whether liver or muscle is the primary source.
Circulation
The 'good' cholesterol. It removes cholesterol from your arteries and transports it back to the liver. Higher levels protect against cardiovascular disease. Lower levels mean less protection. This matters more than your total cholesterol number. Exercise, especially aerobic activity, is one of the best ways to raise HDL.
The main fat in your blood. It responds quickly to diet and lifestyle changes, making it one of the most modifiable markers. High levels over time contribute to arterial plaque buildup and predict cardiovascular disease and diabetes risk. Reducing refined carbohydrates and alcohol, alongside increasing omega-3 intake, can dramatically lower Triglycerides.
Counts the actual particles that can lodge in artery walls and cause blockages. Standard cholesterol tests don't measure this. It's an earlier and more accurate predictor of cardiovascular risk than LDL or other 'bad' cholesterol markers. Diet, exercise and omega-3s can help lower ApoB.
Inflammation
High-sensitivity C-reactive protein measures inflammation throughout your body. Elevated levels are linked to increased cardiovascular risk, even when cholesterol looks normal. Lower levels indicate your body is under less inflammatory load. Diet quality, exercise and weight loss are the most effective ways to reduce hs-CRP.
A naturally occurring amino acid. High levels damage blood vessel walls and are independently associated with heart attack and stroke risk, as well as Alzheimer's disease and dementia. B vitamins, particularly B12 and folate, can lower it effectively, but most people never get tested. Especially important if you have a history of cardiovascular disease.
A waste product of normal metabolism. Beyond causing gout, elevated levels correlate with insulin resistance, hypertension, and kidney disease. It reflects overall metabolic health and responds to dietary changes, particularly reducing alcohol and following a Mediterranean or ketogenic diet.
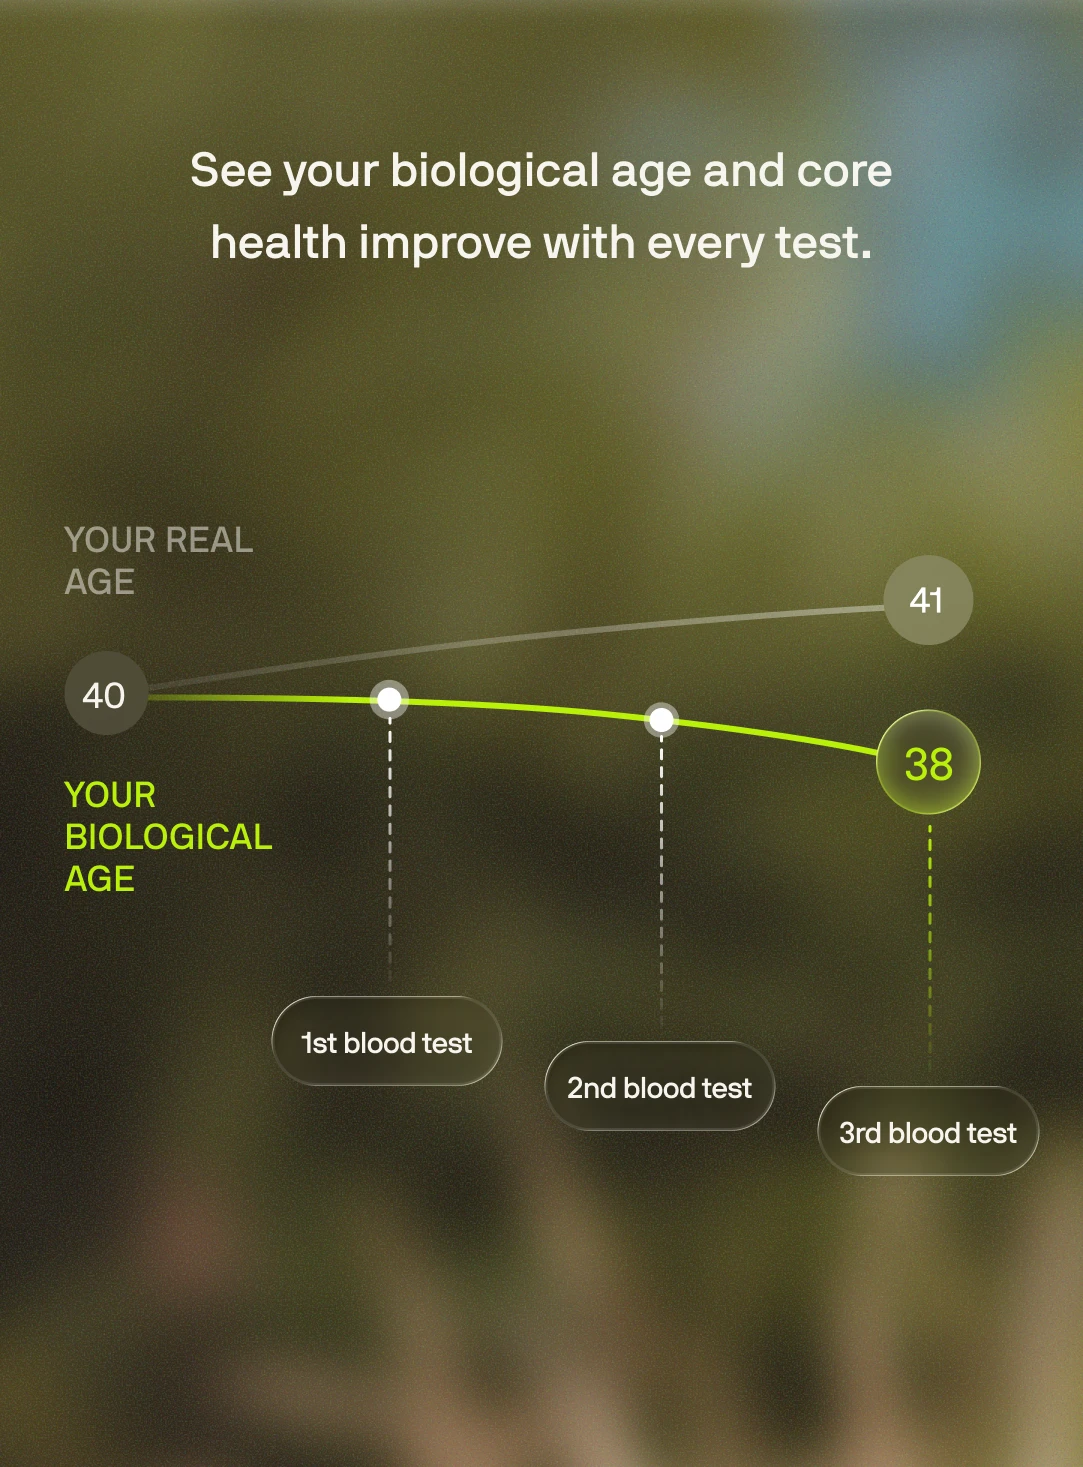
We calculate your biological age based on your core health areas.
.png)
Once a year, we run a full health screen with
50 biomarkers.
Heart Health
The 'good' cholesterol. It removes cholesterol from your arteries and transports it back to the liver. Higher levels protect against cardiovascular disease. Lower levels mean less protection. This matters more than your total cholesterol number. Exercise, especially aerobic activity, is one of the best ways to raise HDL.
The main fat in your blood. It responds quickly to diet and lifestyle changes, making it one of the most modifiable markers. High levels over time contribute to arterial plaque buildup and predict cardiovascular disease and diabetes risk. Reducing refined carbohydrates and alcohol, alongside increasing omega-3 intake, can dramatically lower Triglycerides.
High-sensitivity C-reactive protein measures inflammation throughout your body. Elevated levels are linked to increased cardiovascular risk, even when cholesterol looks normal. Lower levels indicate your body is under less inflammatory load. Diet quality, exercise and weight loss are the most effective ways to reduce hs-CRP.
A naturally occurring amino acid. High levels damage blood vessel walls and are independently associated with heart attack and stroke risk, as well as Alzheimer's disease and dementia. B vitamins, particularly B12 and folate, can lower it effectively, but most people never get tested. Especially important if you have a history of cardiovascular disease.
A waste product of normal metabolism. Beyond causing gout, elevated levels correlate with insulin resistance, hypertension, and kidney disease. It reflects overall metabolic health and responds to dietary changes, particularly reducing alcohol and following a Mediterranean or ketogenic diet.
Counts the actual particles that can lodge in artery walls and cause blockages. Standard cholesterol tests don't measure this. It's an earlier and more accurate predictor of cardiovascular risk than LDL or other 'bad'
The sum of all cholesterol in your blood. While high levels can indicate cardiovascular risk, this number alone doesn't tell the full story. The balance between 'good' HDL and 'bad' LDL matters more, along with markers like ApoB and triglycerides. Context is everything with cholesterol.
Often called 'bad' cholesterol because it can build up in artery walls and cause blockages. High levels increase your risk of heart attacks and strokes. Diet, exercise and weight management can lower LDL, though genetics play a significant role too. ApoB gives a more accurate picture of your actual cardiovascular risk.
Total cholesterol minus HDL. This captures all the potentially harmful cholesterol particles in your blood, including LDL and others. A better predictor of cardiovascular risk than LDL alone because it accounts for all atherogenic particles that can damage your arteries.
Blood Sugar
Your average blood sugar over the past three months. This number shows whether your body handles glucose well or if you're developing insulin resistance. High levels indicate diabetes risk. Unlike daily glucose tests, HbA1c reveals long-term control and is the key marker for diabetes diagnosis and management.
Measures how hard your body works to manage blood sugar. High insulin means your cells aren't responding properly anymore. This often rises before blood sugar becomes problematic, making it an early warning sign of metabolic trouble. Lifestyle changes can significantly improve this marker.
The amount of sugar in your blood after an overnight fast. This snapshot shows how well your body manages glucose at rest. Elevated levels suggest your cells are struggling to absorb sugar efficiently, raising diabetes risk. Interpreted alongside HbA1c and fasting insulin for the complete metabolic picture.
Stands for 'Homeostatic model assessment of insulin resistance'. Combines your fasting glucose and insulin to assess how resistant your cells are to insulin. Higher scores mean your body needs more insulin to control blood sugar—an early warning that your metabolism is under strain. This often shows problems before glucose rises significantly.
Blood Cell Health
Your body's iron storage protein. Low levels usually mean iron deficiency, causing fatigue, weakness and poor concentration. High levels can indicate inflammation, liver disease or, less commonly, iron overload. Most people with low ferritin feel noticeably better once iron stores are replenished through diet or supplementation.
The protein in red blood cells that carries oxygen around your body. Low levels mean you're anaemic—your tissues aren't getting enough oxygen, causing tiredness, breathlessness and poor concentration. High levels might indicate dehydration or polycythaemia. One of the most important markers of blood health.
The percentage of your blood made up of red cells. It moves with haemoglobin—low in anaemia, high in dehydration or polycythaemia. This helps confirm what haemoglobin is showing and gives a fuller picture of your blood's oxygen-carrying capacity. Usually changes in parallel with haemoglobin levels.
The number of red blood cells in your blood. Interpreted alongside MCV, MCH and MCHC to understand the type and cause of anaemia or polycythaemia. Different patterns point to different underlying issues—iron deficiency, B12 deficiency, genetic conditions or chronic disease.
Mean cell volume measures the average size of your red blood cells. Large cells suggest B12 or folate deficiency, alcohol excess or thyroid problems. Small cells point to iron deficiency or inherited red blood cell conditions. This helps identify what's causing anaemia and guides the right treatment approach.
Mean cell haemoglobin measures the average amount of haemoglobin in each red blood cell. It falls in iron deficiency and thalassaemia, and rises when cells are larger. Works together with MCV and MCHC to pinpoint the specific type of anaemia you might have.
Mean cell haemoglobin concentration measures how densely packed with haemoglobin your red cells are. Falls in iron deficiency and rises with dehydration and some inherited red blood cell conditions. Less commonly used than MCV and MCH but adds useful detail to the anaemia picture.
The blood cells responsible for clotting and stopping bleeding. Low counts increase bleeding risk and can indicate bone marrow problems, immune destruction or liver disease. High counts occur with inflammation, iron deficiency or bone marrow disorders. Most variations are mild and reactive to viral illness and chronic inflammatory conditions.
Your total white blood cell count reflects immune system activity. It rises with infection, inflammation and steroid use, and falls with viral illness, certain medications or bone marrow suppression. Persistent abnormalities need investigation to rule out serious underlying conditions.
Neutrophils are your front-line white blood cells that rapidly target and destroy bacteria and fungi. Low counts leave you vulnerable to serious infections and can result from medications, viral illness, autoimmune disease or bone marrow disorders. High counts usually indicate active infection or inflammation.
Kidney Health
A waste product from muscle breakdown that your kidneys filter out of the blood. Raised levels suggest reduced kidney function from acute injury, chronic disease, dehydration or certain medications. Low levels usually reflect low muscle mass. Always interpreted alongside eGFR for the complete kidney health picture.
Estimated glomerular filtration rate is the best overall measure of how well your kidneys are filtering waste from your blood. Lower values indicate chronic kidney disease or acute injury. Persistently reduced eGFR needs investigation and monitoring, as kidney disease often progresses silently without symptoms until advanced.
The main salt in your blood, crucial for maintaining water balance and nerve signals. Low levels occur with diuretic medications, heart or liver failure, or excessive water intake. High levels suggest dehydration or, rarely, diabetes insipidus. Severe abnormalities can affect normal brain function and need urgent correction.
Essential for normal heart rhythm and muscle function. High levels are dangerous to the heart and occur in kidney failure or with certain medications. Low levels follow diuretic use or gastrointestinal losses and can cause dangerous heart rhythm disturbances. Both extremes require further investigation and close monitoring.
A waste product of protein breakdown that healthy kidneys remove from the blood. Rises with dehydration, high protein intake, gastrointestinal bleeding and kidney impairment. Low levels may indicate liver disease or malnutrition. Less specific than creatinine but adds valuable context to kidney function assessment.
Crucial for bone strength, nerve signals and muscle contraction. High levels usually result from overactive parathyroid glands, medications like lithium or thiazide diuretics, or, in very rare cases, cancer in the bone. Low levels occur with vitamin D deficiency, underactive parathyroid glands or kidney disease. Both extremes can cause serious symptoms requiring prompt treatment.
Essential for nerve and muscle function, as well as hundreds of enzyme reactions in your body. Low levels arise from gastrointestinal losses, diuretic medication use and alcohol excess, causing muscle cramps, fatigue and irregular heartbeat. High levels are uncommon and usually relate to kidney problems or excessive supplementation.
Works closely with calcium to maintain bone health and cellular energy production. High levels are common in chronic kidney disease and can damage blood vessels. Low levels occur with refeeding syndrome, alcohol misuse and respiratory alkalosis. Imbalances often go unnoticed until they become severe.
Liver Health
Rises when liver is under strain. Your liver processes everything you consume, so this number reflects how well it's handling the load. Elevated levels are reversible if caught early through diet, exercise, weight loss and reducing alcohol. A key marker for non-alcoholic fatty liver disease.
Shows liver and muscle cell breakdown. Stays elevated when your body isn't recovering properly from alcohol, intense exercise, or metabolic stress. A clear signal to adjust before damage accumulates. Interpreted alongside ALT to understand whether liver or muscle is the primary source.
Alkaline phosphatase rises with bile duct obstruction and increased bone turnover. Marked elevation suggests biliary problems, Paget's disease or healing fractures. It's also physiologically raised during pregnancy. Low values are uncommon and usually clinically insignificant. Context from other liver markers is important.
The yellow pigment produced from red blood cell breakdown. High levels cause jaundice and can indicate haemolysis, Gilbert's syndrome or liver and bile duct disease. Very high levels need urgent investigation. Most mild elevations in otherwise healthy people are harmless and usually reflect dehydration or stress in the context of Gilbert's syndrome.
The main protein your liver makes, essential for maintaining blood volume and transporting nutrients and hormones. Low levels indicate liver disease, kidney protein loss, systemic inflammation or malnutrition. High values usually just mean dehydration. Persistently low albumin suggests significant underlying illness requiring investigation.
The sum of albumin and globulins in your blood. Rises with chronic inflammation, dehydration or abnormal protein production. Falls with malnutrition, protein loss through kidneys or gut, or liver disease. Interpreted alongside albumin and globulin levels to understand the balance and identify potential problems.
A group of proteins including antibodies and inflammation markers. Rises with chronic inflammation, infections and certain blood disorders like myeloma. Falls with immune deficiency or protein loss. Calculated from total protein minus albumin. Abnormal levels warrant further investigation to identify the underlying cause.
Thyroid Health
Thyroid-stimulating hormone is your pituitary gland's signal telling your thyroid to produce more or less thyroid hormone. High TSH means your thyroid is underactive (hypothyroidism). Low TSH suggests an overactive thyroid (hyperthyroidism) or pituitary problems. The best single screening test for thyroid function.
Free thyroxine is the active thyroid hormone circulating in your blood, unbound to proteins. Low levels confirm hypothyroidism when TSH is high. High levels confirm hyperthyroidism when TSH is low. Helps distinguish true thyroid disease from other conditions affecting TSH and guides treatment dose adjustments.
Hormone Health
The primary male sex hormone, important for muscle mass, bone density, mood and sexual function. Low levels in men cause fatigue, reduced muscle, low mood and sexual dysfunction. Can result from testicular problems, pituitary issues, obesity or chronic illness. Repeat testing on two separate mornings needed to confirm diagnosis.
The bioavailable testosterone not bound to carrier proteins—this is what your tissues can actually use. Gives a more accurate functional picture than total testosterone, especially when SHBG levels are abnormal. Low free testosterone better explains symptoms even when total testosterone appears acceptable.
A pituitary hormone that rises physiologically with stress, exercise and sleep, and pathologically with certain medications, hypothyroidism and pituitary tumours. Very high levels need urgent investigation to rule out pituitary adenomas. Mildly raised levels are often benign but may need repeat testing or imaging.
Follicle-stimulating hormone drives egg development in women and sperm production in men. High levels in women indicate diminished ovarian reserve or menopause. Low levels in both sexes suggest pituitary or hypothalamic suppression. Interpreted alongside LH and sex hormones to assess fertility and hormonal status. Due to the normal hormonal shifts in females, results can vary drastically during a typical menstrual cycle. As a result, there is a large 'normal' range.
Luteinising hormone works with FSH to regulate ovulation in women and testosterone production in men. High levels indicate primary ovarian or testicular failure. Low levels suggest pituitary or hypothalamic problems. The ratio of LH to FSH helps diagnose conditions like polycystic ovary syndrome. Due to the normal hormonal shifts in females, results can vary drastically during a typical menstrual cycle. As a result, there is a large 'normal' range.
The main and most potent oestrogen hormone. Levels vary with menstrual cycle phase, ovarian reserve and menopause status. Low after menopause or with ovarian failure. High with ovarian activity, HRT or, rarely, certain tumours. Helps assess menopausal status, fertility potential and whether HRT is working effectively.
Sex hormone-binding globulin is the protein that transports sex hormones in your blood. Rises with oestrogens and hyperthyroidism, which lowers free testosterone. Falls with obesity, insulin resistance and androgens, which raises free testosterone. This marker is used more for calculating bioavailable testosterone and oestrogen levels rather than for standalone interpretation.
Free androgen index estimates the balance of androgens relative to SHBG. Elevated values in women suggest relative androgen excess, as seen in polycystic ovary syndrome. Low values indicate hypoandrogenism. Gives a more functional picture of androgen status than total testosterone alone, especially when SHBG is abnormal.
Vitamins
The 'sunshine' vitamin. Low levels often cause fatigue, poor immune function, and reduced bone density. It's one of the most common deficiencies and one of the simplest to correct. Most people feel the difference within weeks. Your body makes it from sunlight, but many people in the UK need supplementation, especially in winter.
The form of vitamin B12 (holotranscobalamin) that your tissues can actually use. More sensitive for detecting early B12 deficiency than standard total B12 tests. Low levels cause fatigue, nerve damage, memory problems and anaemia. Deficiency arises from poor diet, absorption problems or pernicious anaemia. Supplementation reverses most symptoms.